
Bitcoin has been in bearish territory for the past 7 months, however is starting to show some signs of strength and some minor bullish sentiment. In this Bitcoin Weekly Update will be analyzing the price action using The Strat Algo PRO on a multi timeframe analysis basis to ensure accuracy and possible price targets. Learn the Strat by going through The Strat Algo FREE Guide
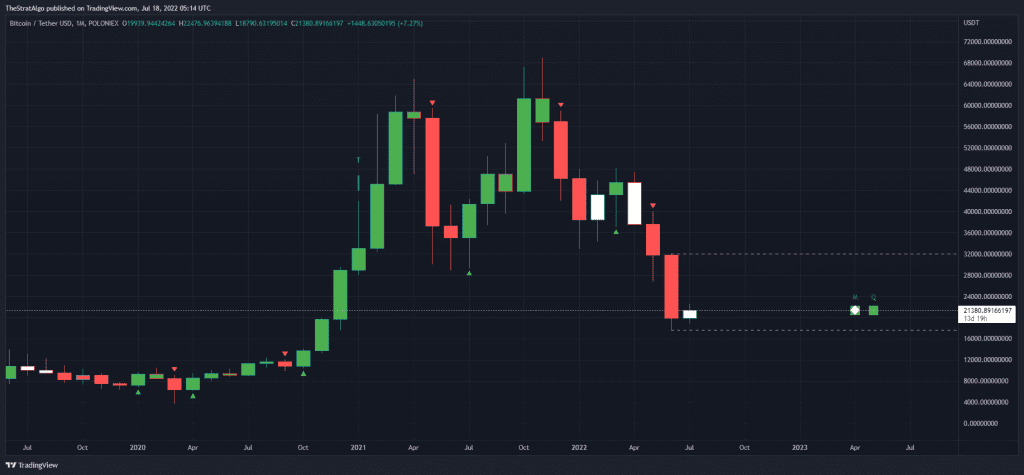
The Above Bitcoin Monthly chart shows some good Timeframe continuity which is a bullish sign, however it is not showing any bullish reversal just yet. A Bullish Reversal could either happen if we close above $32k which is about 52% increase and is not very conservative or possible to happen. Learn the Strat by going through The Strat Algo FREE Guide
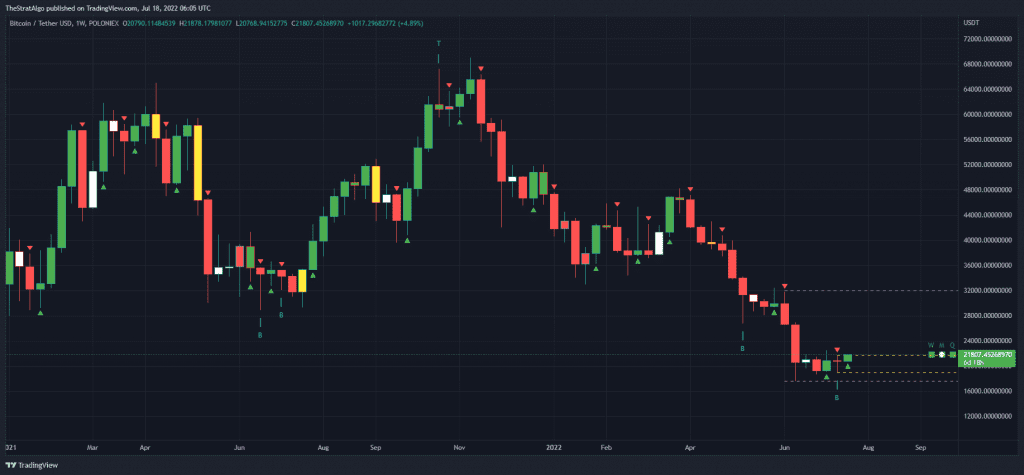
As, For the Bitcoin Weekly chart, We broke previous week high (Yellow dotted line) at $21.4k, The Strat Algo also showing a Bottom candle flagged last week (B Candle) and Strong Bullish Reversal Signal. We also can see how The Time Frames on the right are all bullish (green squares) for Weekly, Monthly and Quarterly. It is very possible that we hit $26.8k on Bitcoin which is about 22% up which could take sometime to build up. Learn the Strat by going through The Strat Algo FREE Guide
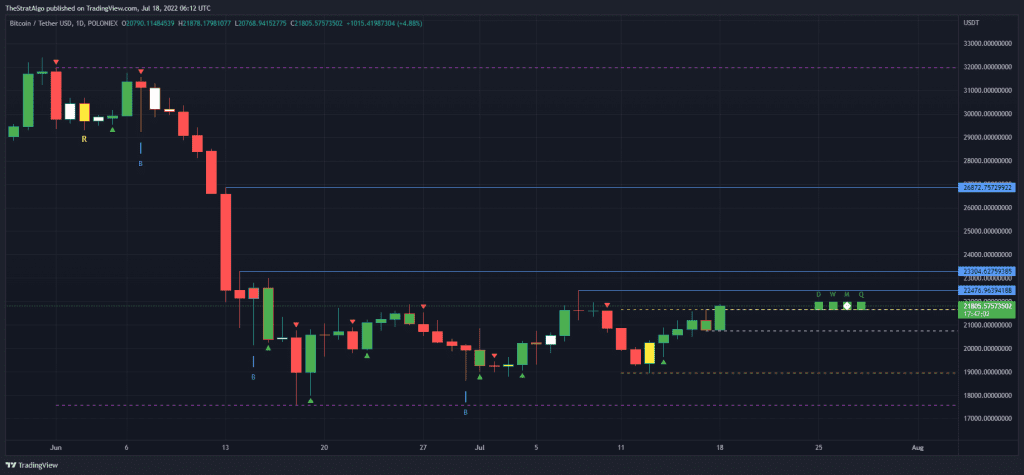
The Daily chart for Bitcoin looks really good, we have got a bullish full time frame continuity (green squares) on Daily, Weekly, Monthly, Quarterly. We also have had a Bullish Reversal few days back and broke previous daily and weekly highs. Next Targets for Daily are possibly are $22.4k, $23.3k at 2.7% and 6.9%. There would also be a potential high end target of is $26.8k at 22% to the upside. Learn the Strat by going through The Strat Algo FREE Guide