Ethereum (ETH) price has been in bearish territory for the past 7 months along with Bitcoin (BTC) price, It has started showing some strength since the ETH Merge announcement within Mid September along with stronger than normal social bullish sentiment. In this Ethereum Price Weekly Update we will be analyzing the price action using The Strat Algo PRO on a multi timeframe analysis basis to ensure accuracy and possible price targets.
Learn the Strat by going through The Strat Algo FREE Guide

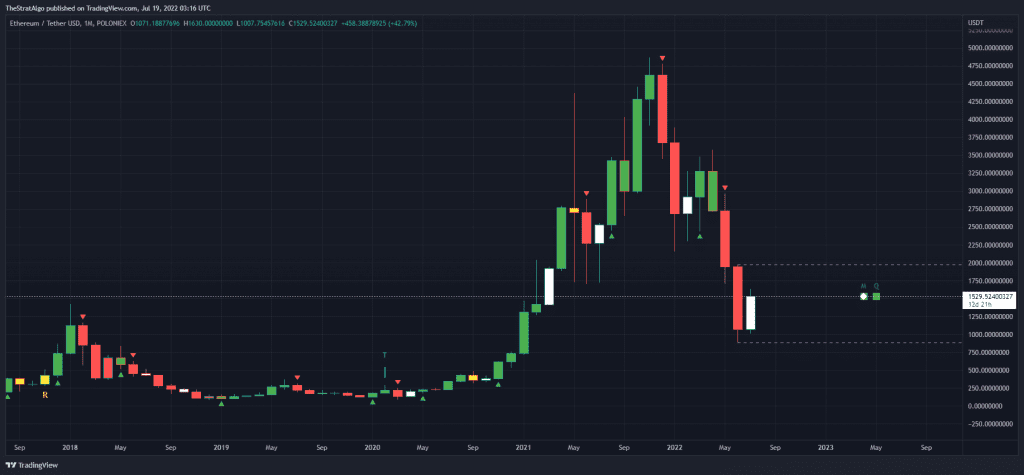
The Above Ethereum (ETH) Monthly chart shows some good Bullish Timeframe continuity (green squares) which is a bullish sign, however it is not showing any bullish reversal just yet. A Bullish Reversal could happen if we close above $2k on the monthly candle which is about 33% increase from current level at $1.5k which is very possible given the strong fundamentals we are seeing, We could also see on the high end just shy of $3,000 per ETH at 100% increase if we continue bullish momentum.
Learn the Strat by going through The Strat Algo FREE Guide

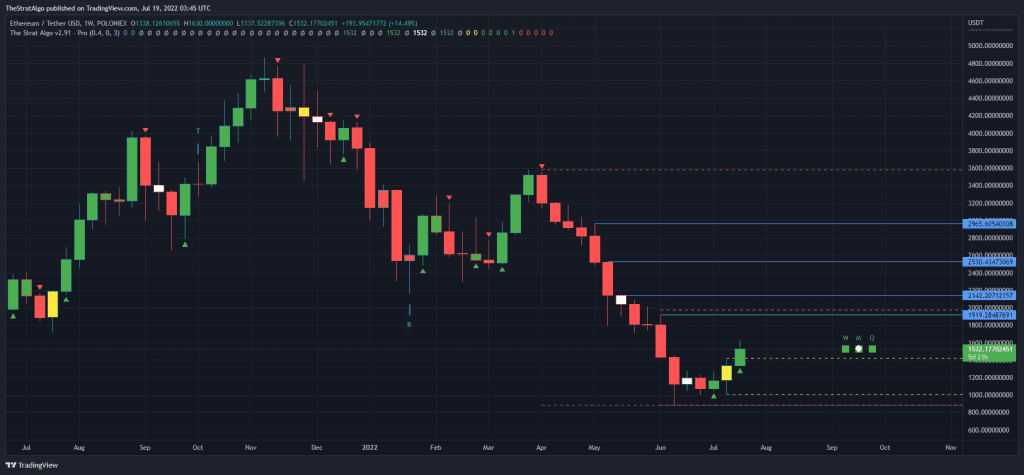
As, For the Ethereum price Weekly chart, We crushed previous week high (Yellow dotted line) at $1.4k, The Strat Algo also showing a Strong Bullish Reversal Signal and Bullish Full Time Frame continuity (green squares) for Weekly, Monthly and Quarterly. It is very possible that we hit $2,000 on Ethereum (ETH) anytime soon which is about 33% increase from current level at $1,500. Some Targets showing on the chart up to $3,000 which is about 100%, however it will require sometime and need the bullish momentum to continue.
Learn the Strat by going through The Strat Algo FREE Guide

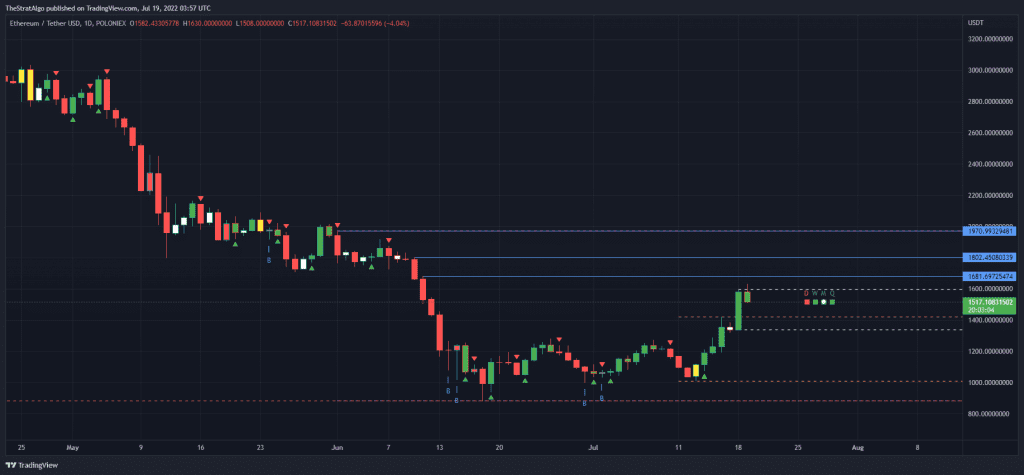
The Daily chart for Ethereum good, however the momentum is fading a bit. There is no bullish full time frame continuity (red + green squares) on Daily since its shown in red but there is on Weekly, Monthly and Quarterly. We also have had a Bullish Reversal few days back and just broke previous daily and weekly highs. Next Targets for Daily are possibly at $1.6k, $1.8k, $2k at 6%, 14% and 43%.


