
Bitcoin has been in bearish territory for the past 7 months, however is starting to show some signs of strength and some minor bullish sentiment per previous Bitcoin Weekly Update. In this Bitcoin Weekly Update will be analyzing the price action using The Strat Algo PRO on a multi timeframe analysis basis to ensure accuracy and possible price targets.
Learn the Strat by going through The Strat Algo FREE Guide
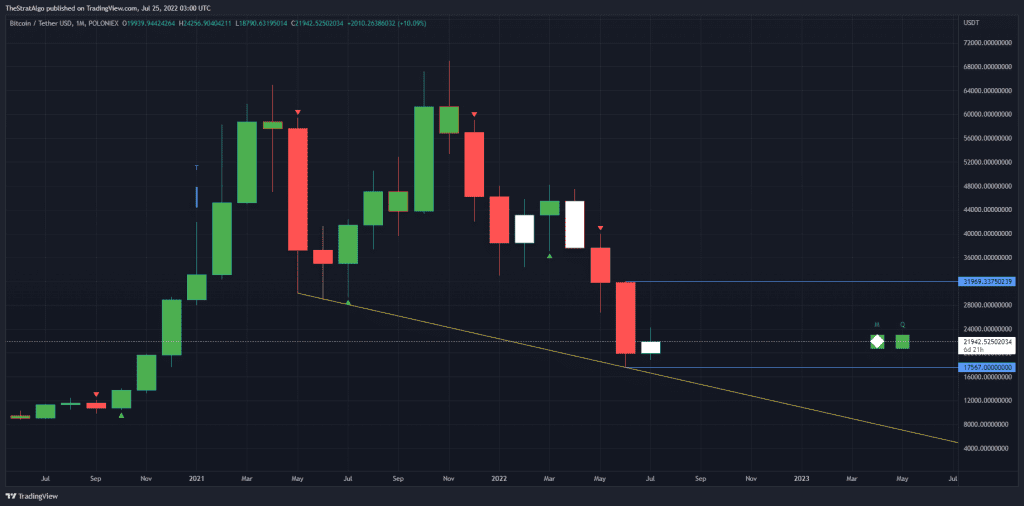
The Above Bitcoin Monthly chart shows some good Timeframe continuity still which is expected since we still have about 1 week to close this monthly candle. Monthly and Quarterly Time frames are bullish, right now on the monthly chart we do have a low end of $17,500 and a high end of about $32,000. These are the higher and lower end possible targets, but we can see lower than $17.5k if its broken according to that yellow low trend line.
Learn the Strat by going through The Strat Algo FREE Guide
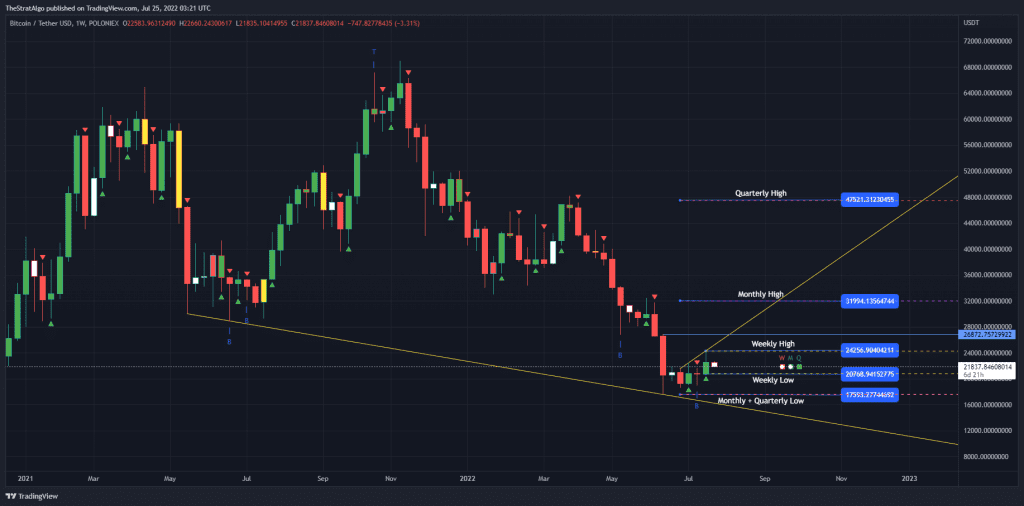
As, For the Bitcoin Weekly chart, We Starting with an inside candle (White Candle) that is yet to complete at week close. As of now the Bullish Signal of Private week is a good entry with an upside to Weekly High at $24.3K and also could hit high end of $26.8K. What is happening now is potentially a small pullback and opportunity to buy more Bitcoin for a small run up which accounts for about 23% Upside. The Time Frame Continuity for the weekly is Red since we opened candle lower than previous weekly one. On the bearish side of things we could hit previous weekly low at $20.7K.
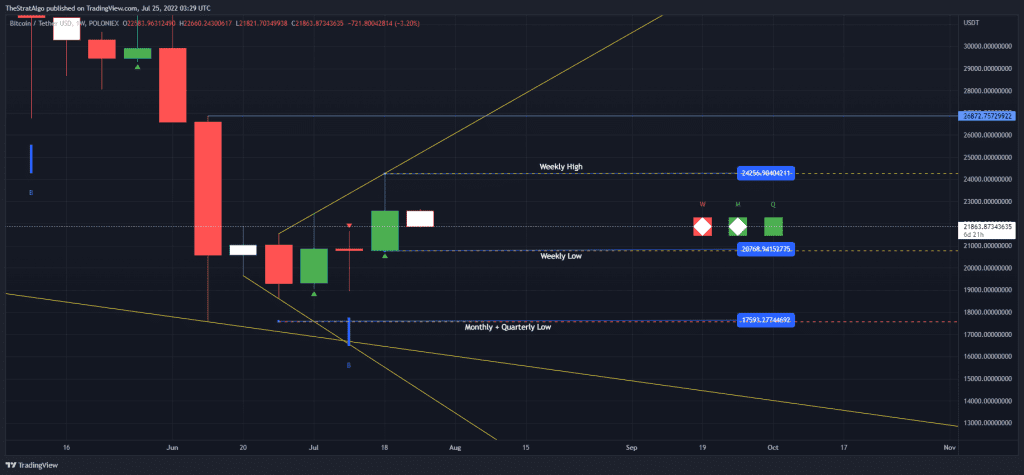
Another look at the Broadening Formation (Yellow Upper and Lower Trend lines) on Weekly Close Up Chart shows that a pull back was due since the Broadening formation upper trend line was hit, which was a signal to exit out of the trade, we might get another hit on the upper trend line again.
Learn the Strat by going through The Strat Algo FREE Guide
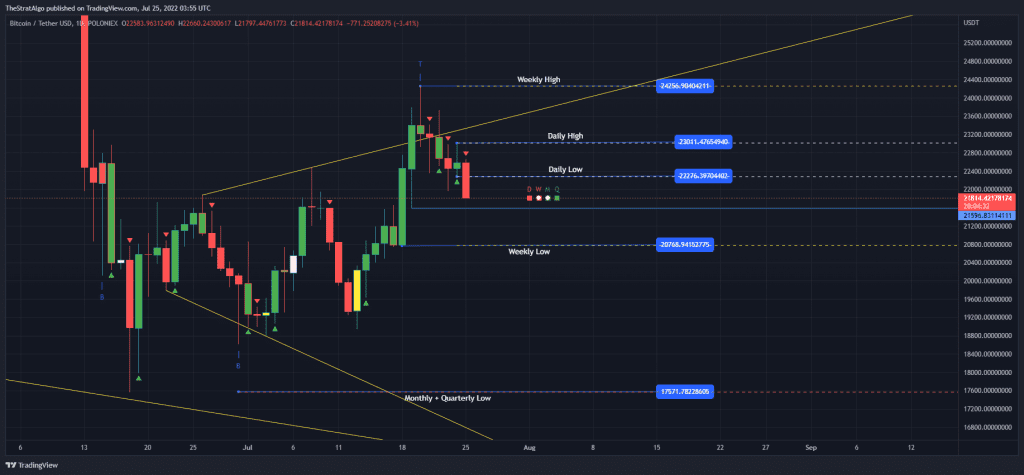
The Daily chart for Bitcoin does not look good, we have got some bearish indicators from Time Frame Continuity on Daily and Weekly to Hitting the Broadening formation upper trend line and lastly it tried to break but issued a Top Signal (Blue T) followed by Bearish Sell Signal (Red Arrow) and also breaking daily low at $22.3k, This will lead Bitcoin to drop to $21.5K then hitting weekly low at $20.7K which is about 5% down.