Ethereum (ETH) price has been in bearish territory for the past 7 months along with Bitcoin (BTC) price, It has started showing some strength since the ETH Merge announcement projected Mid September along with stronger than normal social bullish sentiment. In this Ethereum Price Weekly Update we will be analyzing the price action using The Strat Algo PRO on a multi timeframe analysis basis to ensure accuracy and possible price targets.
Learn the Strat, checkout The Strat Algo FREE Guide

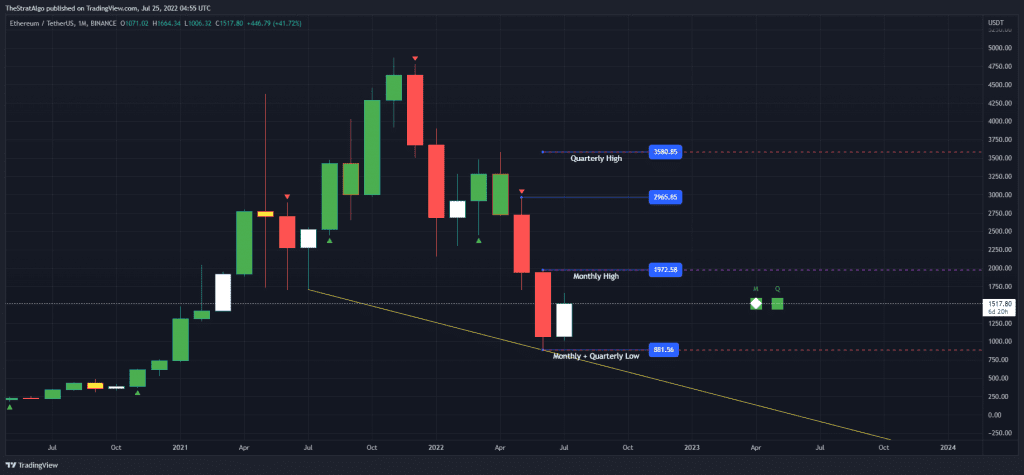
The Above Ethereum (ETH) Monthly chart still shows some good Bullish Timeframe continuity (green squares) which is a bullish sign, however it is not showing any bullish reversal just yet since month of July candle is yet to break out month of June high similar to Previous Ethereum Weekly Update. A Bullish Reversal could happen if we close above $2k on the monthly candle which is about 33% increase from current level at $1.5k which is very possible given the strong fundamentals we are seeing, We could also see on the high end just shy of $3,000 per ETH at 100% increase if we continue bullish momentum.
Learn the Strat, checkout The Strat Algo FREE Guide

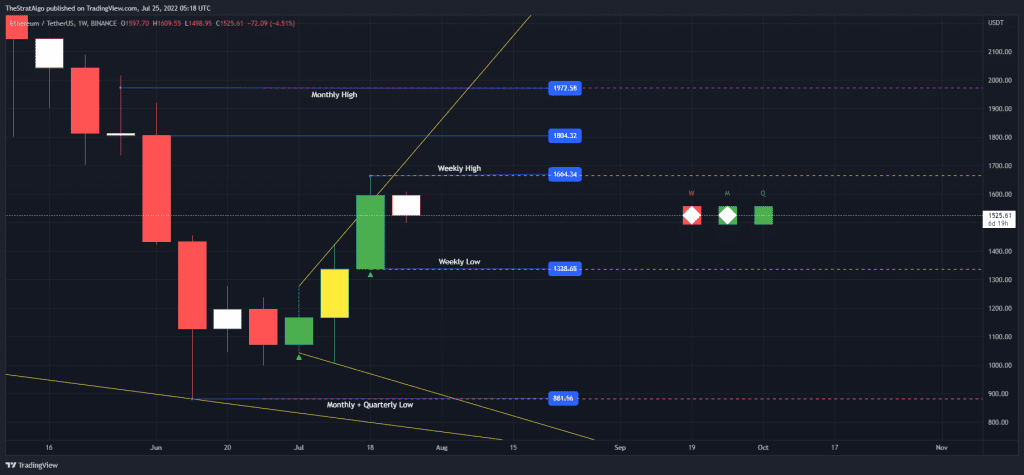
As, For the Ethereum price Weekly chart, We Starting a new weekly candle that is a bit weak or a pullback which could be a great opportunity to buy with a conservative stop loss at $1.3K, The Fact that we have a weaker open on the week and just hit the Broadening formation top trend line is a bearish sign. However we could be going higher after this pullback. If we go below the $1.5K which is 50% of previous week it could be a bearish signals that we hit the low of $1.3K so you should keep an eye on these levels. It is very possible that we hit $2,000 on Ethereum (ETH) which is about 33% increase from current level at $1,500. Some Targets showing on the chart up to $3,000 which is about 100%, however it will require sometime and need the bullish momentum to continue.
Learn the Strat, checkout The Strat Algo FREE Guide

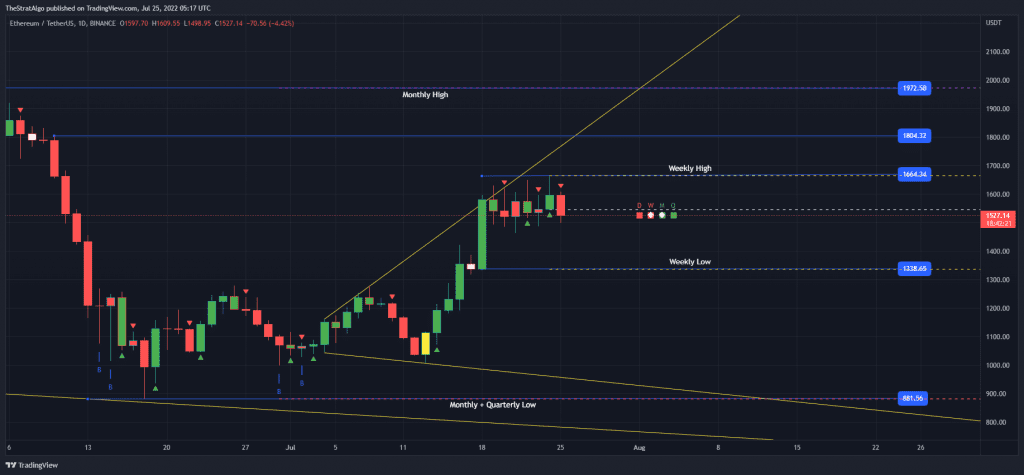
The Daily chart for Ethereum has been moving sideways so far with fading bullish momentum like we mentioned in the previous Ethereum Weekly Update. Looks like it is trying to break that upper trend of the Broadening Formation, However still There is no bullish full time frame continuity (red + green squares). There is a possibility Ethereum drops to $1.3K on low end, however this looks to be ready for another move up towards $1.6K then $1.8K in the short term, and potentially $2k Mid term.
Let us know what do you think Ethereum would reach in the comments section!


