July 2022

Ethereum ETH Logo

Ethereum – Weekly Update 07/25

Ethereum (ETH) price has been in bearish territory for the past 7 months along with Bitcoin (BTC) price, It has started showing some strength since the ETH Merge announcement projected Mid September along with stronger than normal social bullish sentiment. In this Ethereum Price Weekly Update we will be analyzing the price action using The Strat Algo PRO on a multi timeframe analysis basis to ensure accuracy and possible price targets.

Learn the Strat, checkout The Strat Algo FREE Guide

ETH / USD Monthly Chart

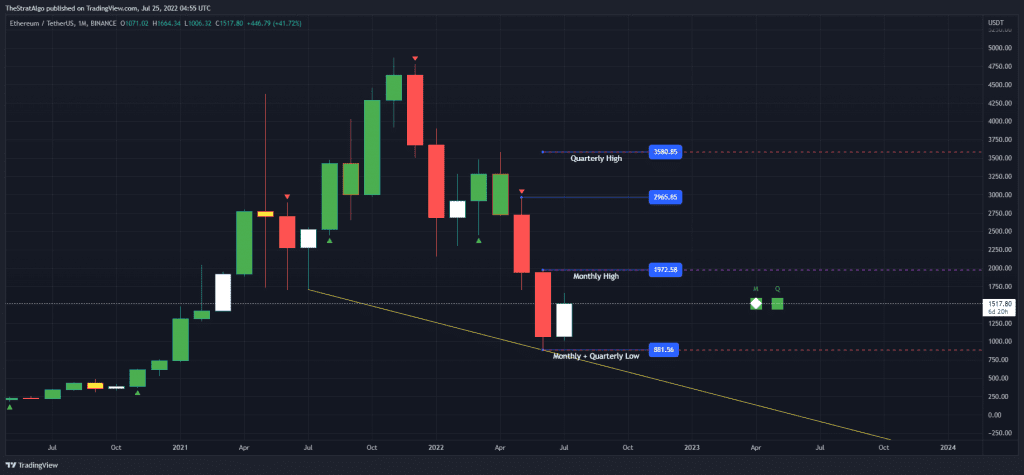
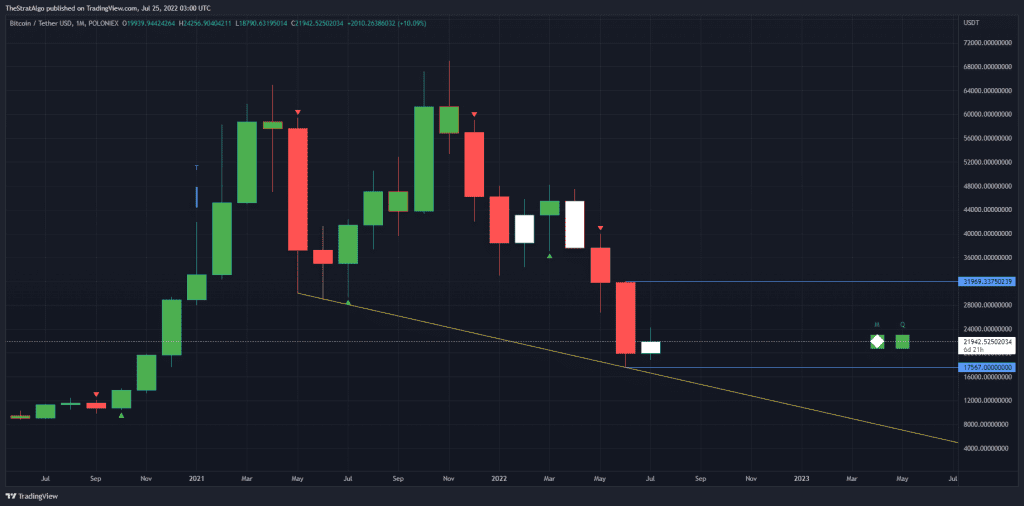
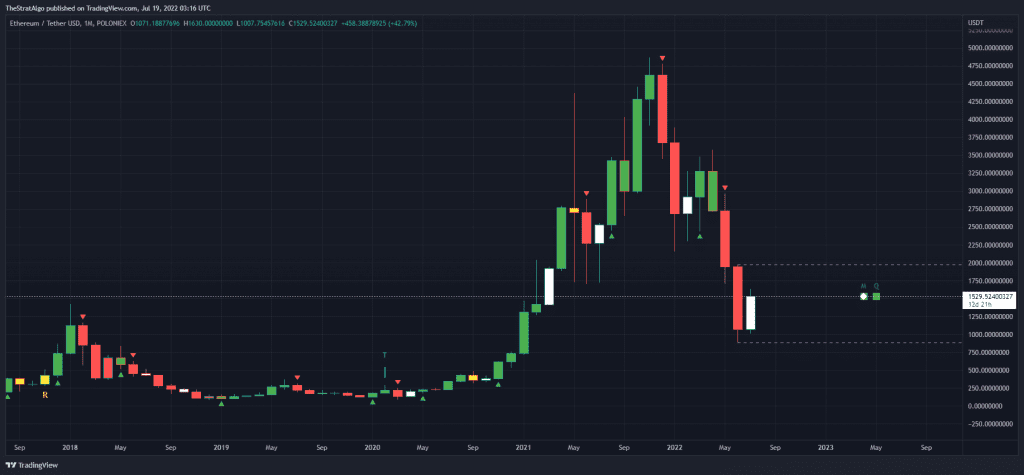
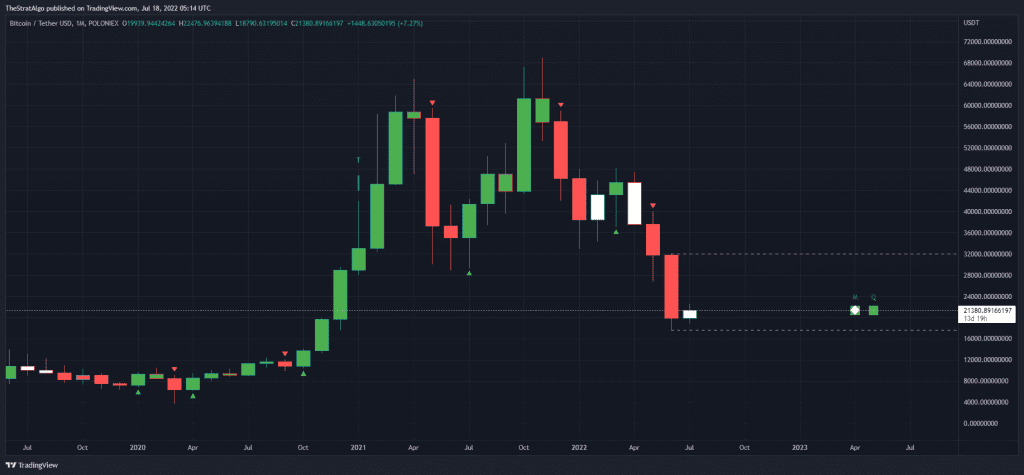
The Above Ethereum (ETH) Monthly chart still shows some good Bullish Timeframe continuity (green squares) which is a bullish sign, however it is not showing any bullish reversal just yet since month of July candle is yet to break out month of June high similar to Previous Ethereum Weekly Update. A Bullish Reversal could happen if we close above $2k on the monthly candle which is about 33% increase from current level at $1.5k which is very possible given the strong fundamentals we are seeing, We could also see on the high end just shy of $3,000 per ETH at 100% increase if we continue bullish momentum.

Learn the Strat, checkout The Strat Algo FREE Guide

ETH / USD Weekly Chart

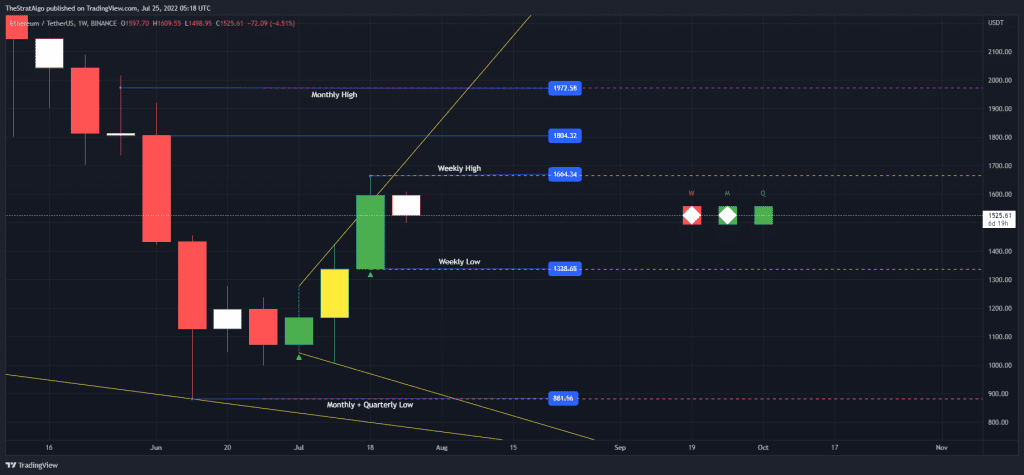
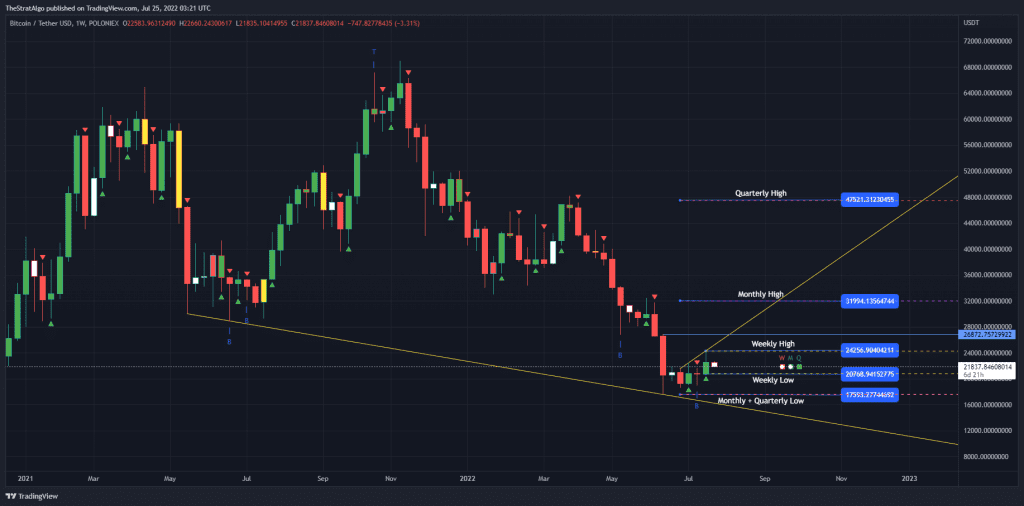
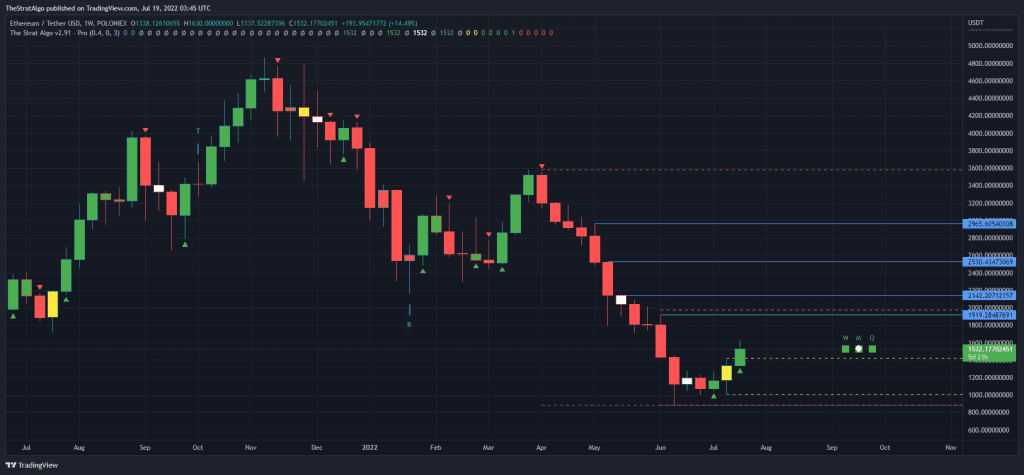
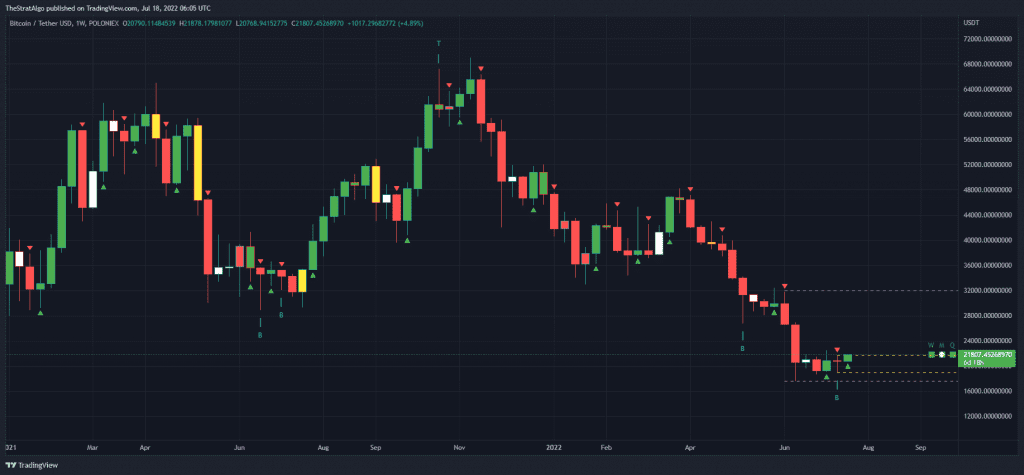
As, For the Ethereum price Weekly chart, We Starting a new weekly candle that is a bit weak or a pullback which could be a great opportunity to buy with a conservative stop loss at $1.3K, The Fact that we have a weaker open on the week and just hit the Broadening formation top trend line is a bearish sign. However we could be going higher after this pullback. If we go below the $1.5K which is 50% of previous week it could be a bearish signals that we hit the low of $1.3K so you should keep an eye on these levels. It is very possible that we hit $2,000 on Ethereum (ETH) which is about 33% increase from current level at $1,500. Some Targets showing on the chart up to $3,000 which is about 100%, however it will require sometime and need the bullish momentum to continue.

Learn the Strat, checkout The Strat Algo FREE Guide

ETH / USD Daily Chart

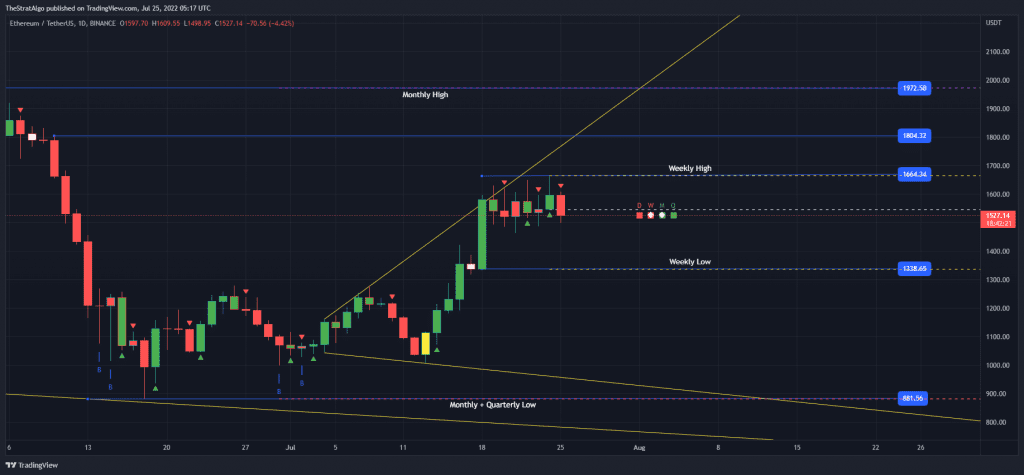
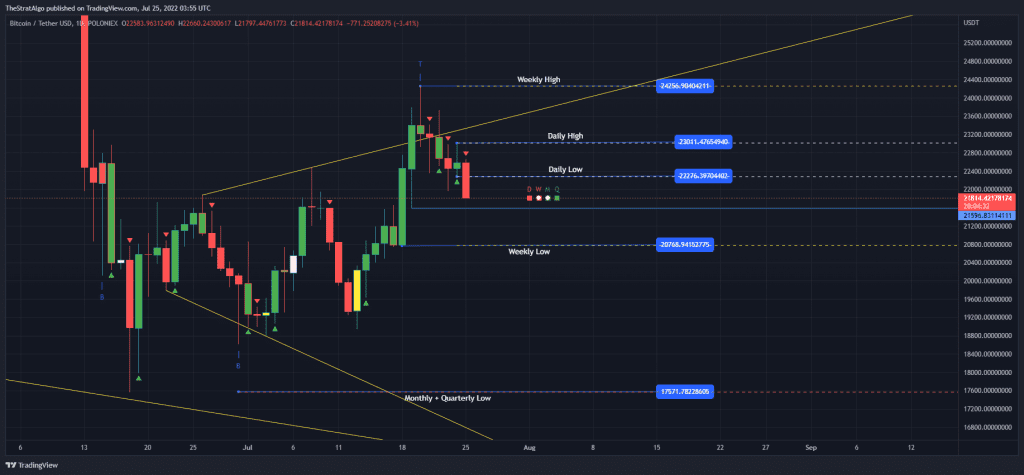
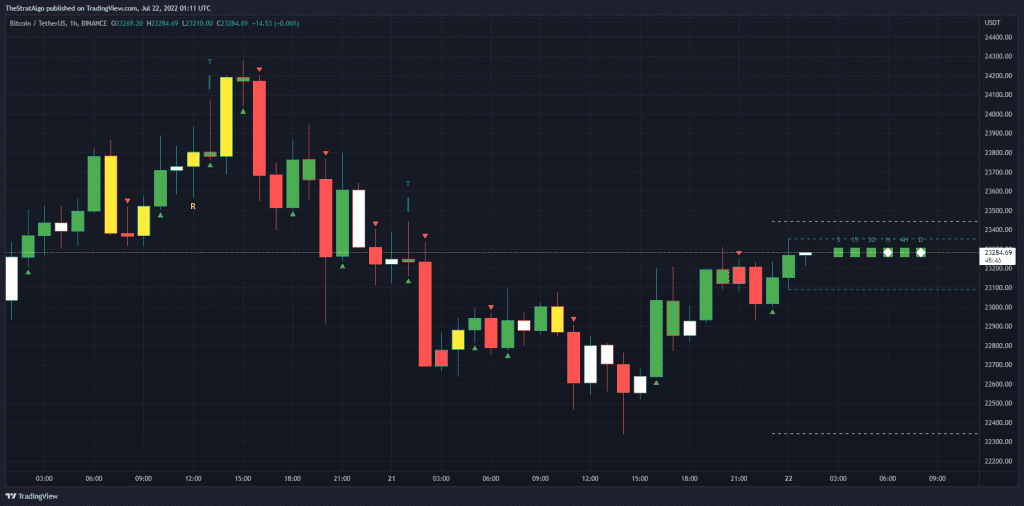
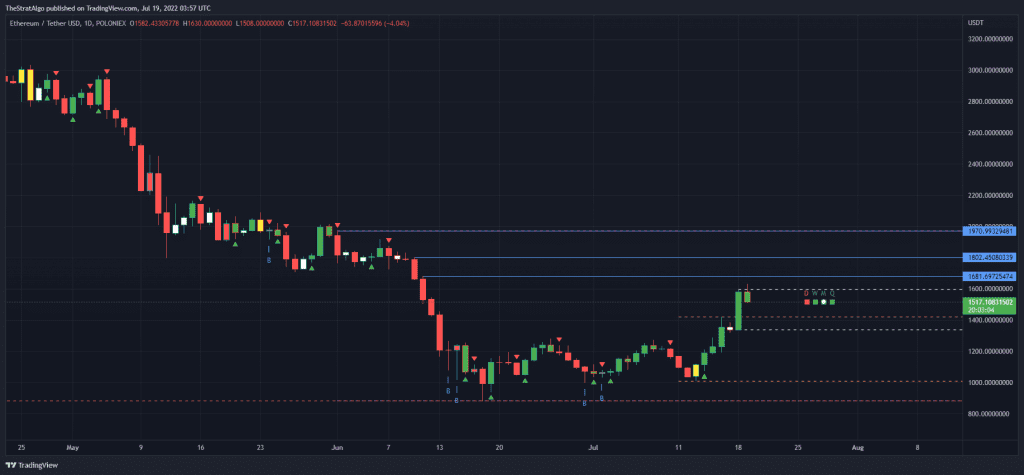
The Daily chart for Ethereum has been moving sideways so far with fading bullish momentum like we mentioned in the previous Ethereum Weekly Update. Looks like it is trying to break that upper trend of the Broadening Formation, However still There is no bullish full time frame continuity (red + green squares). There is a possibility Ethereum drops to $1.3K on low end, however this looks to be ready for another move up towards $1.6K then $1.8K in the short term, and potentially $2k Mid term.

Let us know what do you think Ethereum would reach in the comments section!

Learn the Strat, checkout The Strat Algo FREE Guide

Ethereum – Weekly Update 07/25 Read More »

Bitcoin Close up

Bitcoin – Weekly Update 07/25

Bitcoin has been in bearish territory for the past 7 months, however is starting to show some signs of strength and some minor bullish sentiment per previous Bitcoin Weekly Update. In this Bitcoin Weekly Update will be analyzing the price action using The Strat Algo PRO on a multi timeframe analysis basis to ensure accuracy and possible price targets.

Learn the Strat by going through The Strat Algo FREE Guide

BTC / USD Monthly Chart

The Above Bitcoin Monthly chart shows some good Timeframe continuity still which is expected since we still have about 1 week to close this monthly candle. Monthly and Quarterly Time frames are bullish, right now on the monthly chart we do have a low end of $17,500 and a high end of about $32,000. These are the higher and lower end possible targets, but we can see lower than $17.5k if its broken according to that yellow low trend line.

Learn the Strat by going through The Strat Algo FREE Guide

BTC / USD Weekly Chart
BTC / USD Weekly Chart – Close Up

As, For the Bitcoin Weekly chart, We Starting with an inside candle (White Candle) that is yet to complete at week close. As of now the Bullish Signal of Private week is a good entry with an upside to Weekly High at $24.3K and also could hit high end of $26.8K. What is happening now is potentially a small pullback and opportunity to buy more Bitcoin for a small run up which accounts for about 23% Upside. The Time Frame Continuity for the weekly is Red since we opened candle lower than previous weekly one. On the bearish side of things we could hit previous weekly low at $20.7K.

Another look at the Broadening Formation (Yellow Upper and Lower Trend lines) on Weekly Close Up Chart shows that a pull back was due since the Broadening formation upper trend line was hit, which was a signal to exit out of the trade, we might get another hit on the upper trend line again.

Learn the Strat by going through The Strat Algo FREE Guide

BTC / USD Daily Chart

The Daily chart for Bitcoin does not look good, we have got some bearish indicators from Time Frame Continuity on Daily and Weekly to Hitting the Broadening formation upper trend line and lastly it tried to break but issued a Top Signal (Blue T) followed by Bearish Sell Signal (Red Arrow) and also breaking daily low at $22.3k, This will lead Bitcoin to drop to $21.5K then hitting weekly low at $20.7K which is about 5% down.

Learn the Strat by going through The Strat Algo FREE Guide

Bitcoin – Weekly Update 07/25 Read More »

Ethereum ETH Logo

Ethereum – Weekly Update 07/18

Ethereum (ETH) price has been in bearish territory for the past 7 months along with Bitcoin (BTC) price, It has started showing some strength since the ETH Merge announcement within Mid September along with stronger than normal social bullish sentiment. In this Ethereum Price Weekly Update we will be analyzing the price action using The Strat Algo PRO on a multi timeframe analysis basis to ensure accuracy and possible price targets.

Learn the Strat by going through The Strat Algo FREE Guide

ETH / USD Monthly Chart

The Above Ethereum (ETH) Monthly chart shows some good Bullish Timeframe continuity (green squares) which is a bullish sign, however it is not showing any bullish reversal just yet. A Bullish Reversal could happen if we close above $2k on the monthly candle which is about 33% increase from current level at $1.5k which is very possible given the strong fundamentals we are seeing, We could also see on the high end just shy of $3,000 per ETH at 100% increase if we continue bullish momentum.

Learn the Strat by going through The Strat Algo FREE Guide

ETH / USD Weekly Chart

As, For the Ethereum price Weekly chart, We crushed previous week high (Yellow dotted line) at $1.4k, The Strat Algo also showing a Strong Bullish Reversal Signal and Bullish Full Time Frame continuity (green squares) for Weekly, Monthly and Quarterly. It is very possible that we hit $2,000 on Ethereum (ETH) anytime soon which is about 33% increase from current level at $1,500. Some Targets showing on the chart up to $3,000 which is about 100%, however it will require sometime and need the bullish momentum to continue.

Learn the Strat by going through The Strat Algo FREE Guide

ETH / USD Daily Chart

The Daily chart for Ethereum good, however the momentum is fading a bit. There is no bullish full time frame continuity (red + green squares) on Daily since its shown in red but there is on Weekly, Monthly and Quarterly. We also have had a Bullish Reversal few days back and just broke previous daily and weekly highs. Next Targets for Daily are possibly at $1.6k, $1.8k, $2k at 6%, 14% and 43%.

Learn the Strat by going through The Strat Algo FREE Guide

Ethereum – Weekly Update 07/18 Read More »

Bitcoin Close up

Bitcoin – Weekly Update 07/18

Bitcoin has been in bearish territory for the past 7 months, however is starting to show some signs of strength and some minor bullish sentiment. In this Bitcoin Weekly Update will be analyzing the price action using The Strat Algo PRO on a multi timeframe analysis basis to ensure accuracy and possible price targets. Learn the Strat by going through The Strat Algo FREE Guide

BTC/USDT Monthly Chart

The Above Bitcoin Monthly chart shows some good Timeframe continuity which is a bullish sign, however it is not showing any bullish reversal just yet. A Bullish Reversal could either happen if we close above $32k which is about 52% increase and is not very conservative or possible to happen. Learn the Strat by going through The Strat Algo FREE Guide

BTC/USDT Weekly Chart

As, For the Bitcoin Weekly chart, We broke previous week high (Yellow dotted line) at $21.4k, The Strat Algo also showing a Bottom candle flagged last week (B Candle) and Strong Bullish Reversal Signal. We also can see how The Time Frames on the right are all bullish (green squares) for Weekly, Monthly and Quarterly. It is very possible that we hit $26.8k on Bitcoin which is about 22% up which could take sometime to build up. Learn the Strat by going through The Strat Algo FREE Guide

BTC/USDT Daily Chart

The Daily chart for Bitcoin looks really good, we have got a bullish full time frame continuity (green squares) on Daily, Weekly, Monthly, Quarterly. We also have had a Bullish Reversal few days back and broke previous daily and weekly highs. Next Targets for Daily are possibly are $22.4k, $23.3k at 2.7% and 6.9%. There would also be a potential high end target of is $26.8k at 22% to the upside. Learn the Strat by going through The Strat Algo FREE Guide

Bitcoin – Weekly Update 07/18 Read More »

The STRAT Algo Guide

The STRAT Trading Strategy is based on Price Action and is a reaction to price trading where there is no guessing or prediction. This PDF Guide explains The Strat and How to Trade using The STRAT Algo precisely. This is a must read Guide to understand how the strategy works and be successful at trading any asset class like Stocks, Crypto, Forex, Commodities, Futures and more.

The STRAT Algo Guide Read More »

What is The STRAT ?

The Price Action Trading Strategy..

The STRAT Trading Strategy is based on Price Action and is a reaction to price trading where there is no guessing or prediction. THE STRAT classifies the Candlesticks into types named “1”, “2” and “3” and also utilizes multiple Time Frame Analysis and levels, Time Frame Continuity in order to provide you with accurate signals that you can rely on while trading. This is a Quick Guide to get you started Trading The STRAT Algo which makes it easier to make and keep more of your Profits.


The STRAT Candlesticks

The STRAT Candlesticks are classified into one of these three candles based On the relation to the previous candle.

CandleStick 1: Also Called inside Candle in relation to the previous candle and is colored in WHITE. Inside Candle is weak and considered indecisive price action (The candle High and Low are within the previous candle High and Low prices)

CandleStick 2: Also Called Directional Candle in relation to the previous candle and is colored GREEN or RED depending on direction. Directional Candles are strong and drives the direction of the price Up or Down (The candle is GREEN if it breaks the High of previous Candle Only and RED if Price Breaks previous Candle Low only instead.)

CandleStick 3: Also Called Outside Candle in relation to the previous candle and is colored in YELLOW. Outside Candles are strong and usually means Reversal in Price Action (The candle High and Low Broke the previous candle High and Low prices)

What is The STRAT ? Read More »